
Validation
The models compared with measurements they were not fitted to, including the comparisons that came out badly.
How to read this page
The tables below are produced by a script in the Python reference engine and copied here unedited, so they cannot drift from the code. Where a row is marked as a fit anchor, the model was adjusted to match it, and agreement there proves nothing. The other rows are independent.
Three things are unresolved, and we would rather say so than hide them.
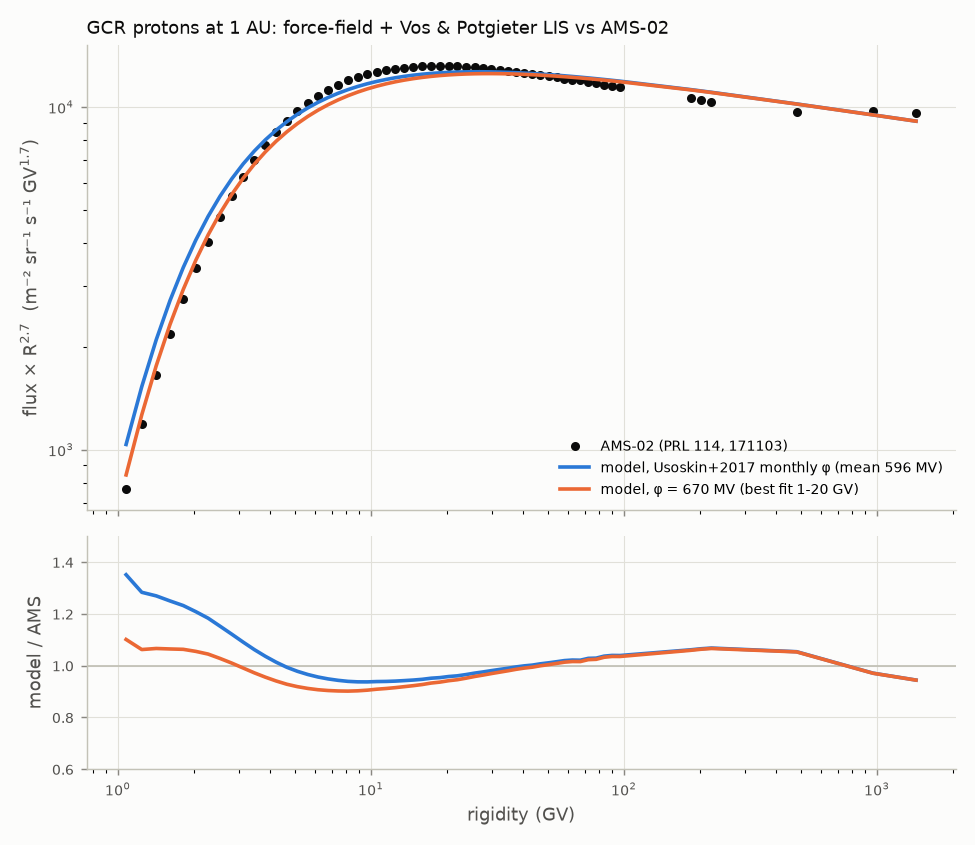
- Low-energy cosmic-ray protons run high. With the modulation potential taken from neutron monitors, protons at 1 to 3 GV are 12 to 35 % above AMS-02. Refitting the potential closes the gap, which points at the force-field approximation itself.
- SHIELDOSE-2 disagrees with the Geant4 fold at thin depths for the August 1972 event, by more than geometry explains. It looks like a normalization convention. We have not resolved it.
- The mean quality factor on the Space Station is too low, 1.7 to 1.9 against a measured 3.3, because a point dose leaves out fragments made inside the body.
Two pictures
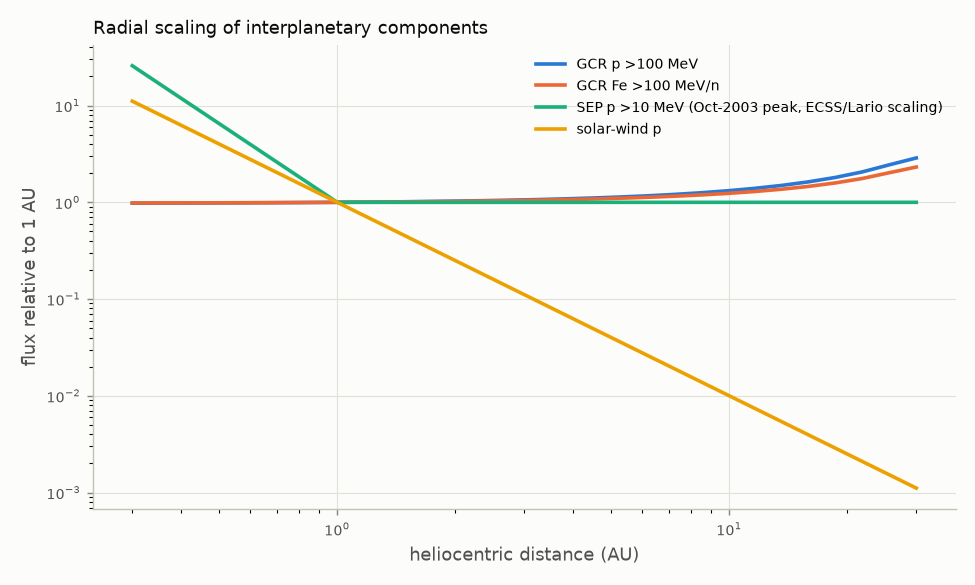
Results
Model values against published measurements. Sources are listed in the bibliography of this repository.
GCR protons vs AMS-02 2011-2013
| R (GV) | AMS | model (Usoskin phi) | ratio | model (phi=670) | ratio |
|---|---|---|---|---|---|
| 1.08 | 626.9 | 847.3 | 1.35 | 690.4 | 1.10 |
| 1.61 | 605.9 | 757.5 | 1.25 | 645.1 | 1.06 |
| 2.82 | 335.9 | 376.9 | 1.12 | 339.3 | 1.01 |
| 4.65 | 143.8 | 142.9 | 0.99 | 133.5 | 0.93 |
| 9.67 | 27.24 | 25.54 | 0.94 | 24.67 | 0.91 |
| 20.28 | 3.894 | 3.731 | 0.96 | 3.668 | 0.94 |
| 43.47 | 0.4716 | 0.4727 | 1.00 | 0.4689 | 0.99 |
| 96.44 | 0.05026 | 0.05224 | 1.04 | 0.05205 | 1.04 |
| 963.77 | 8.571e-05 | 8.325e-05 | 0.97 | 8.322e-05 | 0.97 |
SEP event fluences: Band-fit model vs GOES (cm^-2)
| event | model >10 | GOES >10 | ratio | model >30 | GOES >30 | ratio |
|---|---|---|---|---|---|---|
| sep2000_jul14 | 2.3e+10 | 1.65e+10 | 1.39 | 3.02e+09 | 4.31e+09 | 0.70 |
| sep2001_nov04 | 1.86e+10 | 1.52e+10 | 1.23 | 2.42e+09 | 3.4e+09 | 0.71 |
| sep2003_oct28 | 1.51e+10 | 1.17e+10 | 1.29 | 2.12e+09 | 3.07e+09 | 0.69 |
| sep2005_jan20 | 8.09e+08 | 8.27e+08 | 0.98 | 3.3e+08 | 4.1e+08 | 0.80 |
| sep2006_dec13 | 4.92e+08 | 4.62e+08 | 1.07 | 1.55e+08 | 1.67e+08 | 0.93 |
Geomagnetic cutoff at 500 km
max vertical Rc = 15.4 GV at (7, 96); Smart & Shea grids give ~15-17 GV over SE Asia at ISS altitudes.
AP8MIN >10 MeV peak at 500 km: 4.2e+03 cm^-2 s^-1 at (-35, -54).
Orbit-averaged integral fluxes (cm^-2 s^-1), phi=600 MV, Kp=2, AP8/AE8 MIN, quiet Sun
| orbit | p>10 trapped | p>10 GCR | p>100 total | e>1 trapped | He>10/n GCR | Fe>10/n GCR | n>1 albedo | γ 10keV-10MeV |
|---|---|---|---|---|---|---|---|---|
| ISS 400 km 51.6° | 29.6 | 0.504 | 8.7 | 305 | 0.0755 | 0.000241 | 0.285 | 32.7 |
| SSO 800 km 98.6° | 292 | 1.11 | 100 | 3.17e+03 | 0.141 | 0.000426 | 0.424 | 36.7 |
| MEO/GPS 20200 km 55° | 0 | 2.94 | 2.91 | 9.38e+05 | 0.341 | 0.000992 | 0.0211 | 43.9 |
| GEO 75°W | 0 | 3.02 | 2.97 | 2.69e+05 | 0.345 | 0.00101 | 0.00539 | 44.1 |
| interplanetary 1 AU | 0 | 3.04 | 2.99 | 0 | 0.348 | 0.00101 | 0 | 44.1 |
Albedo neutrons (cm^-2 s^-1): model vs measurements
| measurement | conditions | measured | OGO-6-anchored model (default) | Kole 2015 as published |
|---|---|---|---|---|
| OGO-6 1-10 MeV (Jenkins+1971) - fit anchor | Rc<=0.3 GV, 1969 | 0.28 | 0.279 | 0.311 |
| OGO-6 1-10 MeV (Jenkins+1971) - fit anchor | Rc>=12 GV, 1969 | 0.035 | 0.0349 | 0.0108 |
| Salyut-6 thermal-~5 MeV | mag. equator, 350 km, 1975-80 | 0.06 | 0.0608 | 0.0167 |
| Salyut-6 thermal-~5 MeV | 45 deg | 0.43 | 0.322 | 0.0474 |
| Salyut-6 thermal-~5 MeV | 60 deg | 0.58 | 0.639 | 0.593 |
| Balloon leakage, thermal-20 MeV (PRL 20, 1048, 1968) | 42 deg, solar min | 0.36 | 0.337 | 0.0684 |
| OGO-6 total leakage 10 eV-5 MeV | lambda=0, 1969 | 0.08 | 0.0545 | 0.018 |
| OGO-6 total leakage 10 eV-5 MeV | lambda=70, 1969 | 0.8 | 0.537 | 0.519 |
Oxygen at ~1 AU, 1975-77 (phi = 516 MV): GCR+ACR model vs HELIOS E6 (cm^-2 s^-1 sr^-1 (MeV/n)^-1)
| bin (MeV/n) | HELIOS | model GCR | model ACR | model total | note |
|---|---|---|---|---|---|
| 9-13 | 3.88e-06 | 1.37e-07 | 3.74e-06 | 3.88e-06 | ACR fit anchor |
| 13-28 | 8.11e-07 | 2.35e-07 | 5.76e-07 | 8.11e-07 | ACR fit anchor |
| 21-48 | 3.15e-07 | 3.52e-07 | 9.3e-08 | 4.45e-07 | independent |
| 52-83 | 4.54e-07 | 5.44e-07 | 5.8e-09 | 5.5e-07 | independent (GCR only) |
ACR solar-cycle factor vs phi: 400 MV: 1, 516 MV: 1, 650 MV: 0.215, 800 MV: 0.0427, 950 MV: 0.00937, 1100 MV: 0.00224
LEO trapped protons >10 MeV, orbit average (cm^-2 s^-1), AP8MIN native field
| orbit | AP8 raw | x Armstrong & Colborn (2000) | modern-field AP8 (not recommended) |
|---|---|---|---|
| ISS 400 km 51.6 | 15.5 | 29.6 | 74 |
| HST 540 km 28.5 | 48.8 | 96.4 | 153 |
| SSO 800 km 98.6 | 151 | 292 | 248 |
Solar-flare neutrons, 1982 June 3 (Chupp 1990 emission spectrum, decay in flight)
| quantity | model | reference |
|---|---|---|
| fluence >50 MeV at 1 AU (cm^-2) | 245 | ~270 (Dunphy et al., as reported in Chupp 1998: 1991 Jun 11 limit <27 cm^-2 is ">10x less than 1982 Jun 3") |
| survival of 10 MeV neutrons to 1 AU | 0.021 | "only a few percent" (Muraki group review) |
| emission >50 MeV (sr^-1) | 1.69e+29 | ~2.2e29 (same source) |
Flare gamma-ray lines and hard X-rays (peak flux at 1 AU)
| GOES class | F35 (ph cm^-2 s^-1 keV^-1) | photon index | 2.223 MeV (ph cm^-2 s^-1) | 0.511 MeV | nuclear de-excitation total |
|---|---|---|---|---|---|
| M1 | 0.493 | 3.29 | 1.23e-06 | 4.01e-08 | 3.11e-06 |
| X1 | 7.89 | 2.30 | 0.00129 | 0.000194 | 0.00326 |
| X5 | 54.9 | 2.30 | 0.166 | 0.0729 | 0.42 |
| X17.2 | 243 | 2.30 | 6.94 | 6.91 | 17.5 |
Check: 2003 Oct 28 (X17.2) total 2.223 MeV fluence measured by INTEGRAL/SPI ~1400 ph cm^-2 (Kiener et al. 2006); the model peak flux x ~10-20 min gives ~4167-8333, i.e. x3-6 high but within the ~x10 scatter of the line-flux vs GOES relation.
Trapped ACR oxygen at L = 2, ~600 km (cm^-2 s^-1 sr^-1 (MeV/n)^-1)
| phi (MV) | model at 20 MeV/n | SAMPEX/MAST 1992-98 (Leske et al. 1999, 26th ICRC, Fig. 1) |
|---|---|---|
| 450 | 4.26e-05 | 1e-5 to 1e-4 (rising toward the 1996-97 minimum) |
| 550 | 2.86e-05 | 1e-5 to 1e-4 (rising toward the 1996-97 minimum) |
| 700 | 5.28e-06 | 1e-5 to 1e-4 (rising toward the 1996-97 minimum) |
Jovian electrons at 1 AU (e- m^-2 s^-1 sr^-1 MeV^-1, synodic average)
| E (MeV) | Jovian model | galactic, this package (force field, phi 500) | note |
|---|---|---|---|
| 1 | 350 | 3.09e-06 | normalization (350 at 1 MeV) |
| 3 | 47.2 | 1.82e-05 | |
| 10 | 3.15 | 0.000158 | |
| 20 | 0.351 | 0.000564 | |
| 30 | 0.0626 | 0.00117 |
The force-field galactic electron intensity below ~100 MeV is far below the drift-diffusion models (~4 at 1 MeV, Nndanganeni & Potgieter 2018): Jovian electrons dominate 1-25 MeV either way.
GCR dose behind aluminum (Geant4 response matrices) vs MSL/RAD cruise 2011-12
phi = 577 MV (Usoskin, Dec 2011 - Jul 2012), r = 1.2 AU. RAD (Zeitlin et al. 2013; Guo et al. 2015): Si 0.332 +- 0.023 mGy/day, plastic 0.461 +- 0.092 mGy/day, 1.84 +- 0.33 mSv/day. RAD sat behind a broad shielding distribution, mostly below ~10-20 g/cm^2.
| Al (g/cm^2) | Si (mGy/d) | water (mGy/d) | dose equiv. (mSv/d) | |
|---|---|---|---|---|
| 0.3 | 0.307 | 0.380 | 2.42 | 6.37 |
| 1 | 0.303 | 0.378 | 2.26 | 5.98 |
| 3 | 0.296 | 0.373 | 1.87 | 5.03 |
| 10 | 0.304 | 0.398 | 1.44 | 3.61 |
| 30 | 0.334 | 0.473 | 1.06 | 2.24 |
Charged particles: point dose (fluence x stopping power). Neutrons and photons: mean dose in a 15 cm water sphere from Geant4 coefficients. Both are included in the water columns.
ISS Columbus (DOSIS passive dosimeters, Berger et al. 2016, SWSC 6, A39) vs model behind 20-30 g/cm^2 Al
| epoch | altitude | measured (uGy/day, 11 locations) | model water 20 / 30 g/cm^2 (uGy/day) | model dose equiv. 20 / 30 (uSv/day) | model 20 / 30 |
|---|---|---|---|---|---|
| 2010.5 (phi 474) | 350 km | 195-270 | 294 / 246 | 553 / 461 | 1.88 / 1.87 |
| 2012.5 (phi 626) | 400 km | 260-360 | 438 / 322 | 747 / 543 | 1.70 / 1.69 |
DOSIS-1 measured = 3.3 +- 0.1 (TLD + track detectors). The model
is lower, because the point-dose method leaves out target fragments made inside the body by protons. Trapped protons are anisotropic in LEO; the fold treats them as isotropic.
Proton dose in Si behind Al, Aug 1972 SEP event fluence (Gy): Geant4 fold vs straight-ahead CSDA vs SHIELDOSE-2
| Al (g/cm^2) | Geant4 fold, void average (all secondaries) | straight-ahead CSDA, normal path (= center of a sphere, no nuclear losses) | SHIELDOSE-2 solid sphere (IRBEM) |
|---|---|---|---|
| 0.3 | 49.2 | 80.6 | 29.3 |
| 1 | 19.9 | 27.6 | 15.3 |
| 3 | 5.68 | 7 | 4.69 |
| 10 | 0.517 | 0.789 | 0.636 |
| 30 | 0.0325 | 0.0348 | 0.0116 |
The fold gives the average over the inside of the shell. There, oblique paths through the wall reduce the dose to ~0.6-0.8 of the center value for these steep spectra, so it should sit below the straight-ahead column, and it does. SHIELDOSE-2 through IRBEM comes out below both at thin depths. We have not resolved this; it looks like a normalization convention.
(SEP in fluence mode, so "Gy/s" columns are event totals in Gy.)
Provenance
Generated by engine/validation/run_validation.py with spacerad 0.1.0, numpy 2.5.5, scipy 1.18.1, SpacePy 0.7.0. Do not edit this file by hand: change the script or the engine and regenerate.